This tutorial explains step-by-step how to create a dynamic table to take advantage of all the dynamics available within Documotor. The tutorial focuses on PowerPoint, but the transformation model is the same for Word. There are some differences in the bindings for Word, details of which can be found at the end of the tutorial. The tutorial contains examples of the template
Table of contents
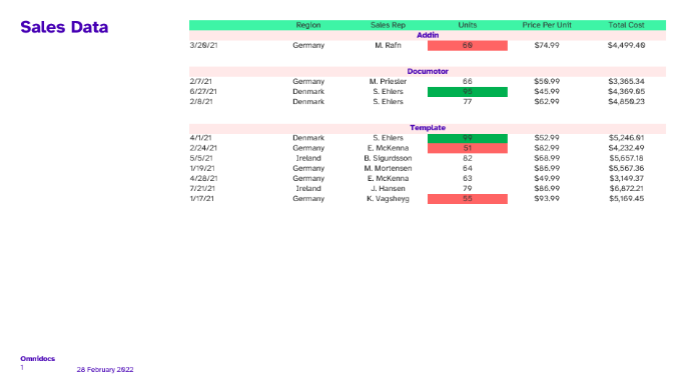
Desired Output
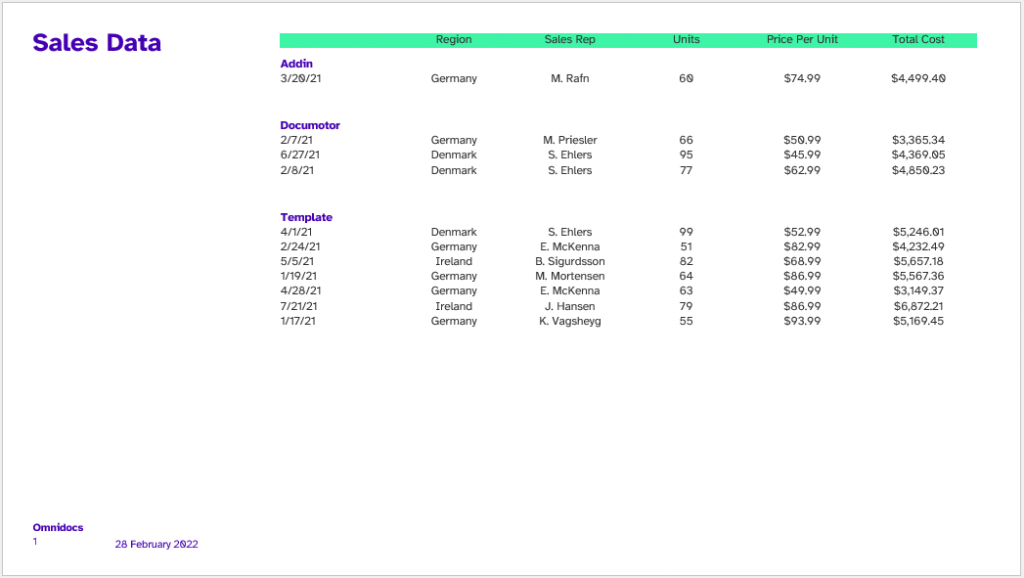
We are going to create an output looking like below image:
Sample data
A copy of the sample data used in this tutorial can be downloaded from here:
Overview
There are X steps to creating the template:
- Define the table. This is done within PowerPoint itself. All formatting should be applied here. It is always best to start with a finished design, so it is clear what the desired output should be.
- Add and format the content which should be presented within the table.
- Create the Transformation required to populate the table.
- Apply the relevant binding to ensure that the transformed data is applied to the table
Dynamic table model
A full specification of the dynamic table model can be found here. This tutorial will not refer to each possible option available within the model, but the sample data and slides found here can be uploaded to Documotor for you to experiment with. The options in the model are all available to be applied to the data and the template here.
Template

Note that this slide contains only 2 rows. It is possible to populate as many rows as you need using just one row.
Adding Content
We need to create fields for all possible different content types within that row and format them as appropriate. NOTE: for each different type of content we must create a different field. We then use our transformations to define the data we need per row and then pass the data to the correct field.
For more information on creating fields in PowerPoint read the article on Fields in PowerPoint. Note dynamic tables differ from static tables in this regard as we do not place a field for each individual data point.
Let’s take a look at the attached table in depth.
Row 1:
- Contains no fields in any cell.
- All cells are formatted identically.
- Dynamic tables work by repeating ONLY the last row so this row will not be repeated.
Row 2:
- All cells contain unique fields references.
- Cell one contains two different fields each formatted differently, ProductHeader and Date.
- This row will be repeated for each data point we need to display.
Design Considerations
Table Length
Native PowerPoint does not support splitting tables automatically across multiple slides. When building tables that may contain lots of data it is worth considering this. However, it is possible to repeat slides so that we can present the data across a number of different copies of the same slide.
Table and Column width
Particularly for Word, it is worth mentioning that in the Table Properties (accessible by right-clicking on the table) the “Preferred width” should be set to 100%, and the columns’ “Preferred width” should be measured in centimeters/pixels. Setting the columns’ “Preferred width” to be measured in percentage, might affect the final table layout in the generated document.
Field Variations
It is possible to include as many variations of fields as possible within a single cell. And any characters not within the field will also be repeated per row, so it is possible to add specific non-dynamic text.
However, this also applies to non-printing characters such as carriage returns. In our example, we have placed both fields on the same line. If instead, we had separated the two fields with a carriage return, each new row would begin with a carriage return and so the spacing would be incorrect.
Transformation
The complete transformation used in this tutorial can be seen below.
{
  ProductsTable: {
    Options: {
      "KeepTotalWidth": `true`
    },
    "Headers": @.DataToShow.[
      {
        "Visible": Date
      },
      {
        "Visible": Region
      },
      {
        "Visible": SalesRep
      },
      {
        "Visible": Product
      },
      {
        "Visible": Units
      },
      {
        "Visible": PricePerUnit
      },
      {
        "Visible": TotalCost
      }
    ],
    Rows: group_adjacent(sort_by(SalesData, &Product),&Product)[*].[
      {
    placeholder: 'placeholder'
    },
      {
        ProductHeader: @[0].Product
      },
      [*].{
        Date: Date,
        Region: Region,
        SalesRep: SalesRep,
        Product: Product,
        Units: Units,
        PricePerUnit: format(to_number(PricePerUnit, 'en-US'), 'c', 'en-US'), //Convert to dollarsTotalCost
        TotalCost: format(to_number(TotalCost, 'en-US'), 'c', 'en-US') //Convert to dollarsTotalCost
      }
    ][][]
  }

}
Transformation Explained
The object that holds the entire table data is called ProductsTable. Within this we have:
Options – This object is optional. In this case, KeepTotalWidth is simply set to be true. This means that if columns are hidden as part of our transformation, the table will automatically resize to fit. Note that this does not refer to the sample data at all, but of course it can do.
Options: {
  "KeepTotalWidth": `true`
}
Headers – Here we are referring to the DataToShow node in our sample data and creating a single object for each element in the node to pass each relevant data point to a value called visible. This is where we control the visibility of each column. If the result is true, the column will be shown, if the result is false it will be hidden.
"Headers": @.DataToShow.[
  {
    "Visible": Date
  },
  {
    "Visible": Region
  },
  .
  .
  .
  {
    "Visible": TotalCost
  }
]
Rows – Here we define the data to be presented in each row. The transformation creates an array where each object refers to a single row.
Let’s take a look at this in detail.
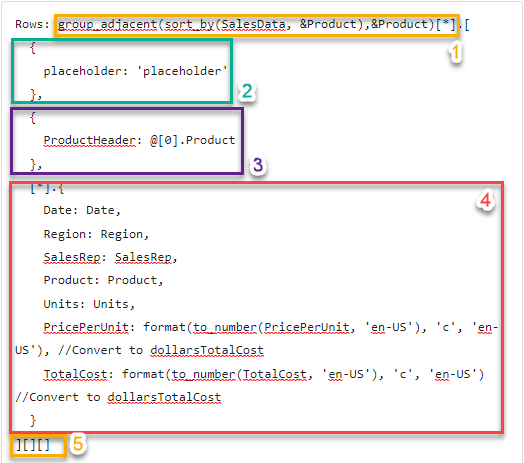
Firstly, we are sorting the data as we need to in point 1. The sample data is not sorted in any particular order. So we apply a simple transformation to it using group_adjacent(sort_by(SalesData, &Product),&Product)[*]. In short, sort-by sorts all of the data into a single array by the Product data node in each object. group_adjacent then splits this single array into separate arrays for each product, 3 in this case. [*] then ensures that rest of the transformation is applied to each of these arrays in turn.
For more information on the sort_by function see here.
For more information on the group_adjacent function see here.
In point 2, we define our first row object. Note that in this case, we are not transforming any sample data at all. When we bind the table to the data, even though the first row is not repeated, it still needs to be considered when defining the data, so we simply create a placeholder object here to create a row.
In point 3, we define our header row. Comparing this to the template, you will notice that the sample data is transformed into a new ProductHeader data point which is defined as a field within the template. The template will use this data in the row and because none of the other fields exist in the output data, they will not be populated when the presentation is generated.

In point 4, we define our remaining rows. The use of [*] indicates that for every object in our data, we will transform this to become a new object with each data point referenced within that object. Note that this entire point could be achieved with a simpler transformation, i.e., [*] which would simply pass all of the data unformatted from the sample data. However, we more often than not want to apply other transformations to the data, as in this example where we format the PricePerUnit and TotalCost data points in US Dollars. For information on how to achieve this, see here.
In point 5, we simply flatten the data we have transformed into a single array. Information on flattening projections can be found here.
Custom Functions
The transformation required to create dynamic tables can often be quite comprehensive. It is often a good idea to consider using custom functions to help with this. A guide on creating custom functions can be found here.
Table Binding
The binding for the table is:
<<DynamicTable:[AltText]$tableData>>
[AltText] refers to a string. This text will appear as the alt text of the table after it has been created. In our example, this is simply DynamicTableExample.
tableData refers to the data point in the output data that contains all the relevant information for the table.
To add the binding, simply select the table, open the alt text pane and add.
Try it out!
Now that we created our dynamic table let’s look at what can be improved or amended about it. Below are just a few examples but feel free to experiment with different options. The specific transformations required to produce these outcomes have not been included in this tutorial but everything you need to create them can be found here.
Hiding the total cost column
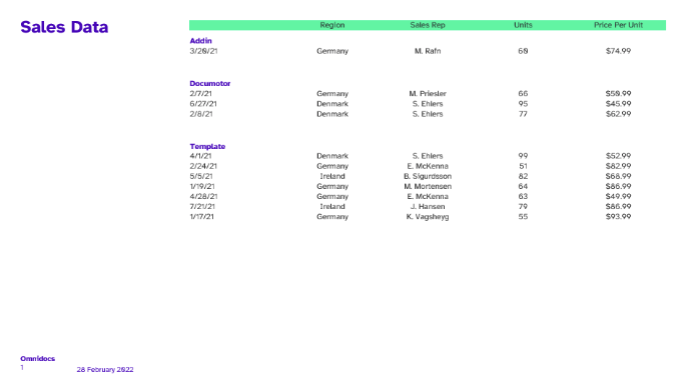
By changing the sample DataToShow.TotalCost value in the sample data we are able to hide the Total cost column so that our output now looks like:
Highlighting High and low performers with cell shading
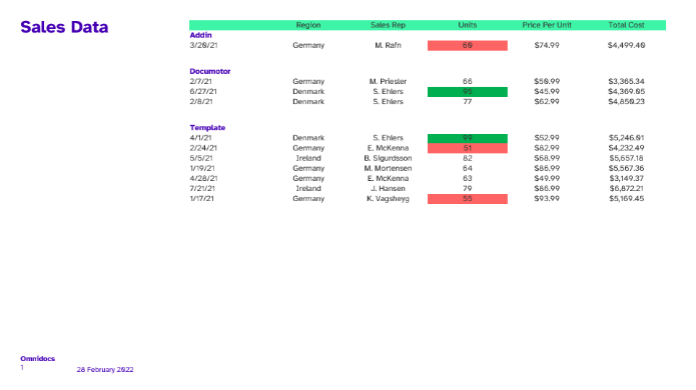
In this example we have:
- Added a
cellsarray to each row as per the dynamic table model. - Converted the
unitsdata point to a number format within the 4th object of the array (corresponding to the 4th column in the template) - Used an if statement to calculate if the value is greater than 90 and if so applied a
BackgroundColorof green. - Used another if statement to calculate if the value is less than 60 and applied a
BackgroundColorof red.
The result is:
Merging and Aligning cells
In this example we have:
- Used the
__mergeCellsmethod on the header rows to merge all cells in that row into a single cell - Used
__alignmentmethod on the header row to align the text to the center. - Set a background colour for the header rows.
Dynamic Tables in Word
As mentioned in the introduction, creating a dynamic table in Word is very similar to PowerPoint. The key differences are:
- Bindings are applied via content controls:
{"BindingType": "DynamicTable", "BindingKey": "tableData" } - The same cell functionality is not currently supported.
More information on the dynamic table model for Word can be found here.