This tutorial will present how to create a CV with DocuMotor. Use this as inspiration if you have a similar task, or feel free to reach out – we are happy to assist.
Before we jump into it, please verify you have all the components you need to get started. These are described in the DocuMotor Project Initiation.
In the following paragraphs, we will go over the different sections of the CV template and describe how the data is transformed and bound to the template.
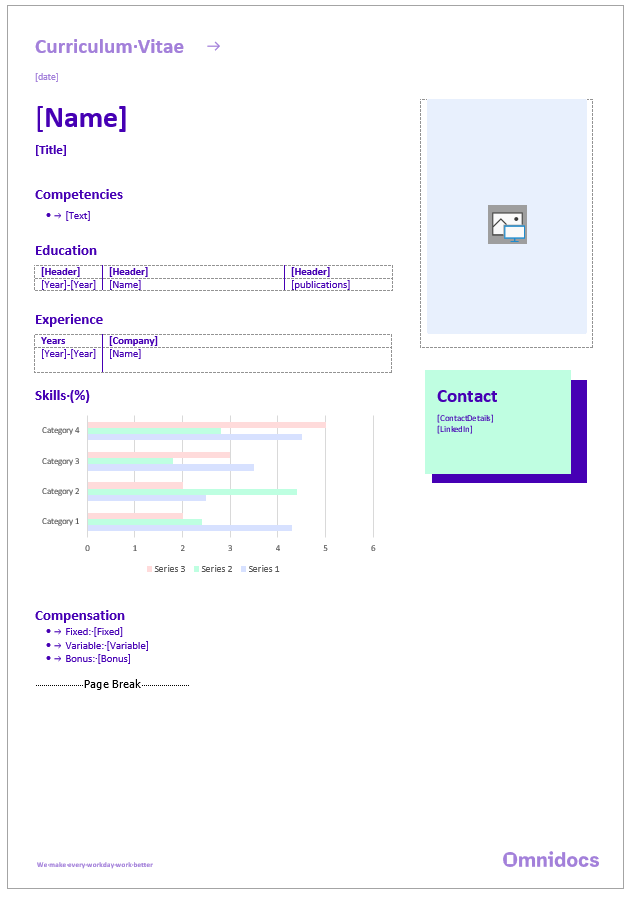
Page structure
In the finished document, we want the CV to be repeated for each candidate represented in the data we are working with. Our sample data, in this case, has two candidates, but as long as the data follows the same structure and is consistent, the number of candidates is irrelevant when creating a DocuMotor document.
In our sample data, as shown below in a shorted and edited version, the candidates are placed in an array[ ] named candidates, and in this array, each candidate is listed in objects{ }.
{
"candidates": [
{
"name": "Jane Johnson",
"title": "Technical Lead",
"image": "https://omnidocs.blob.core.windows.net(...)"
},
{
"name": "John Davis",
"title": "Software Developer",
"image": "https://omnidocs.blob.core.windows.net(...)"
}
]
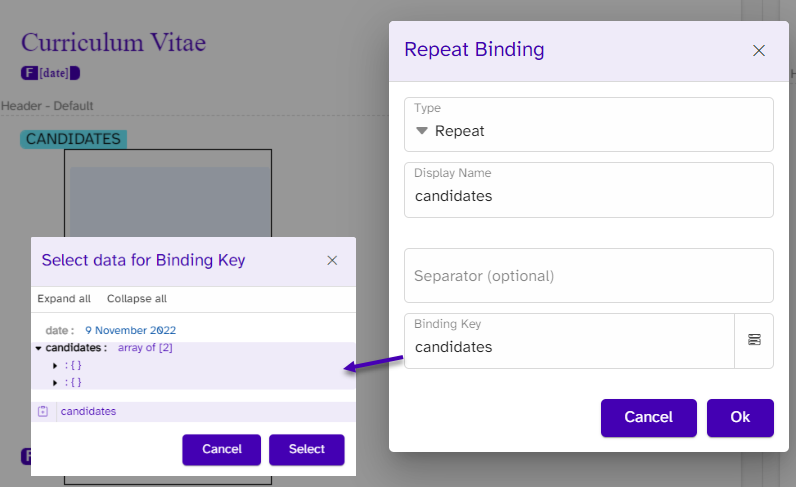
}We do not need to transform this structure, as the structure of arrays with objects is ideal for applying a repeater binding to the template. We add a repeat binding and choose the candidate array; this will add a
rich text content control around all elements in the template and add the following binding in the content control’s tag.
{"BindingType":"Repeat","BindingKey":"candidates"}
The repeat binding type will ensure each object/candidate in the candidate’s array is repeated, and hence one CV is repeated per candidate.
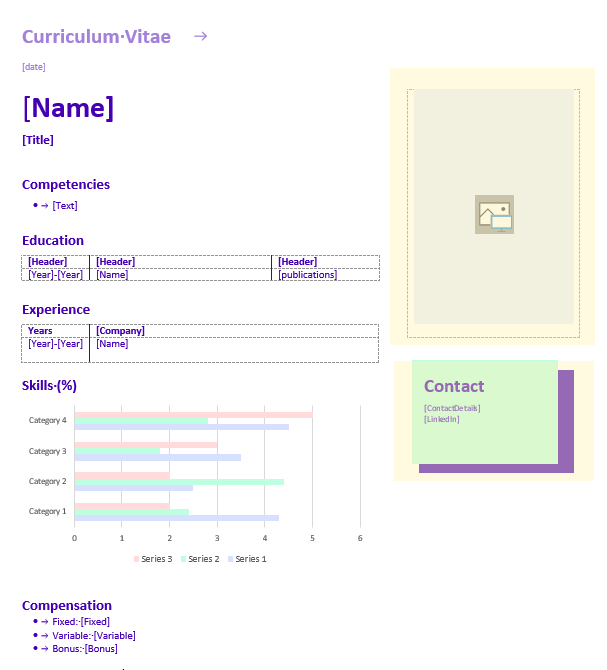
Header, footer, headings, and date
The header, footer, and headings in the template do already look like we want the end result to be because these parts are added directly in the template. Always consider what data we need DocuMotor to transform or adjust. If elements can be added directly in the template because it is static or fixed, save DocuMotor and only use DocuMotor when needed.

The template is mapped with a date field. We can use DocuMotor to create today’s date without this information offered in the data. The function current_time creates a date-time object of the current time in UTC with offset hours added to that time if needed. Because we do not want extra hours added to the UTC time, we use the function with 0 hours added to it (current_time('0')). This will result in a timestamp in Unix format, which looks like this: 2022-10-31T11:10:53.0996644Z. Since the seconds/the last part of this timestamp is not needed in our case, we format it with the format function. This function converts the data to a formatted string based on a format type and culture. In this case, we want the date formatted like this “31 October 2022” meaning we add the format type: d MMMM, yyyy, and the English culture, which will add a standard English syntax if any, and the transformation will look like this:
{
    //no data needed
}
{
date: format(current_time('0'), 'd MMMM yyyy', 'en-GB')
}{
"date": "31 October 2022"
}To bind the date field, we use the field binding and select ‘date’ as the binding key:
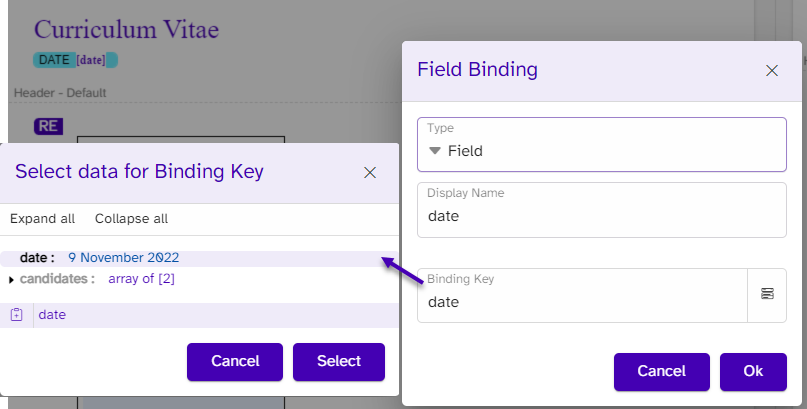
In the content control’s tag, DocuMotor will add the following:
{"BindingType":"Field","BindingKey":"date"}
Fields
Throughout the template, we have some information that only needs to be inserted. These fields are in the template named ‘Name’, ‘Title’, and three compensation values, ‘Fixed’, ‘Variable’ and ‘Bonus’. We know from our mapping that these values are placed in the data.
The first is the name and title; this information is placed in each object representing each candidate. In our transformation, we ask DocuMotor to go over the array named candidates for each candidate/object, which we mark with a star like this: candidates[*]. This means that we are not looping through each candidate of the array and can create an object per candidate and refer directe to the name and title.
{
    "candidates": [
        {
            "name": "Jane Johnson",
            "title": "Technical Lead"
        }
    ]
}
{
candidates: candidates[*].
{
name: name,
jobTitle: title
}
}{
"candidates": [
{
"name": "Jane Johnson",
"jobTitle": "Technical Lead"
}
]
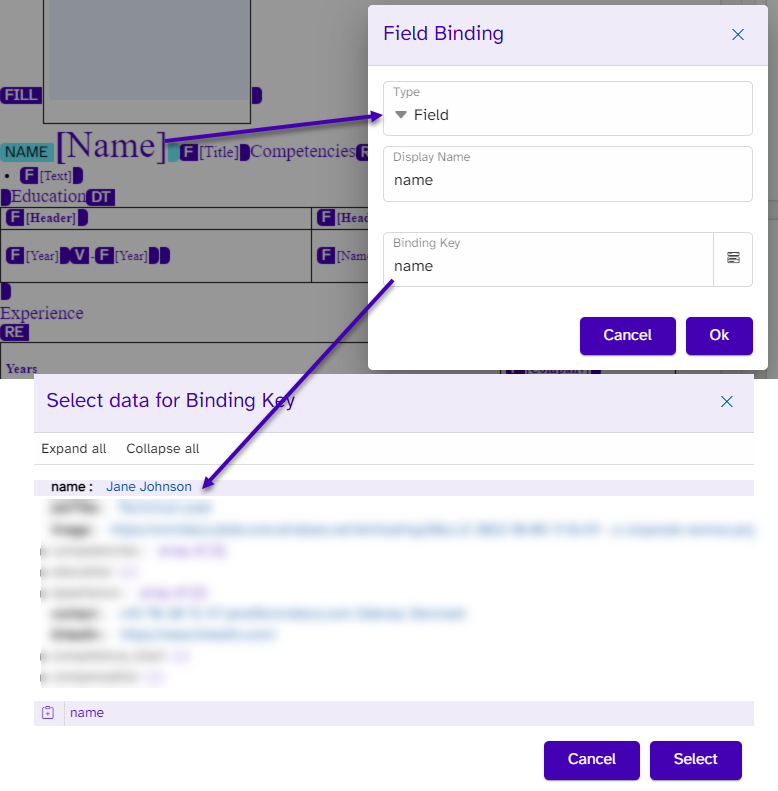
}In the template, we bind using a Field type, and we pick the name in the overview of keys and values that would fit with this type of binding.
In the compensation section, we want three numbers from the data to be inserted. From the data, we have the currency and the values from the two candidates:
//Candidate 1
"compensation": {
    "currency": "DKK",
    "fixed": "650000",
    "variable": null,
    "bonus": null
},
//Candidate 2
"compensation": {
    "currency": "USD",
    "fixed": "94776",
    "variable": "2550",
    "bonus": "5000"
}
With DocuMotor, we want to transform the values into numbers, as they are currently listed wrongly as text/strings and marked with "". We, therefore, use the function to_number to convert the string into a number. Besides a number, we also need to format the results to add the right currency and commas in the numbers. Instead of making a new transformation, we place the to_number the transformation inside the format function as the $data – visualized below:
{
    fixed: format(to_number(fixed,'en-US'), $format, $culture)
}
Besides the data, the format function also needs a format value and a culture value. We don’t want the currency to have any decimals so we give ‘C0’ as the format value. We know the currency from the data, but the IANA code or the culture is not listed in the data for each currency. This information is essential to format the data, but we also need the culture to adjust the currency we receive from the data, meaning if the currency we get is ‘USD’ the iana code we need is ‘en-US’. If DKK we need ‘da-DK’ etc. To solve this, we use DocuMotor to create our own dictionary in a separate data source. This is useful if you work with data structured in a very specific way. In our case, we group the specific inputs with an iana code in objects placed in one array, like this:
[{
    "input" : "USD",
    "iana" : "en-US"
  }, {
    "input" : "DKK",
    "iana" : "da-DK"
  }, {
    "input" : "GBP",
    "iana" : "N/A"
  }, {
    "input" : "PHP",
    "iana" : "N/A"
  }, {
    "input" : "BBD",
    "iana" : "en-BB"
  }, {
    "input" : "BDT",
    "iana" : "en-BD"
  }, {
    "input" : "BGN",
    "iana" : "bg-BG"
  }, {
    "input" : "BHD",
    "iana" : "ar-BH"
  }]
To increase performance, we want to reduce the number of times DocuMotor goes through this list; which is why we created a key named ‘currency’ that uses the datasource function and pulls the inputs we need for each candidate. We pull the data from the data source and look for the input we already have from our data; the result of this lookup is the object of the specific currency we need. To get the iana code for the currency we get that value from the datasource output after the function.
currency: datasource('CurrencyDictionary', 'input', currency).iana
In total, we need to use the currency for three numbers; we use our new key named ‘currency’ ($.currency) that now has the iana code as value. By doing this, we only go through the list once, and in the next transformations, we use this information by referring to this key. The final transformation will look like the following:
//Candidate 1
"compensation": {
    "currency": "DKK",
    "fixed": "650000",
    "variable": null,
    "bonus": null
},
//Candidate 2
"compensation": {
    "currency": "USD",
    "fixed": "94776",
    "variable": "2550",
    "bonus": "5000"
}
{
compensation: compensation.{
currency: datasource('CurrencyDictionary', 'input', currency).iana,
fixed: format(to_number(fixed,'en-US'), 'C0', $.currency),
variable: format(to_number(variable,'en-US'), 'C0', $.currency),
bonus: format(to_number(bonus,'en-US'), 'C0', $.currency)
}
}{
//Candidate 1
"compensation": {
"currency": "da-DK",
"fixed": "650.000 kr.",
"variable": "",
"bonus": ""
},
//Candidate 2
"compensation": {
"currency": "en-US",
"fixed": "$94,776",
"variable": "$2,550",
"bonus": "$5,000"
}
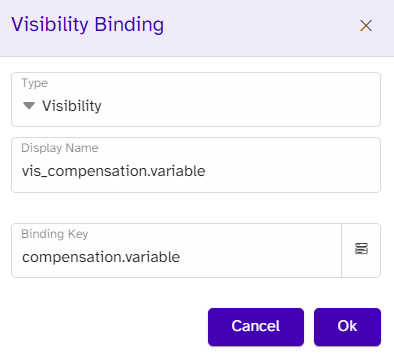
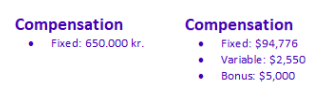
}Note that in the template, the static text ‘Fixed’, ‘Variable’, and ‘Bonus’ is already placed in the template, as we always want these specific words to be visible if the numbers are offered for the candidate in the data. If one number is not offered, we don’t want this static word to show, meaning that candidate 1 will only have one number in their compensation section. We solve this with a visibility binding around the static text and our placeholder text.
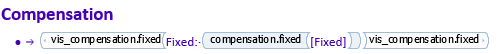
The visibility binding uses the binding type named ‘Visibility’ and will check whether or not the binding key (compensation.fixed) is represented in the data.
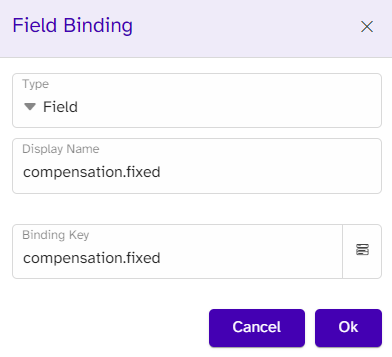
If the key returns empty, the content, which is the static text and the placeholder text, will all disappear. If not, the number will be inserted by the following binding around the placeholder text:
The result will look like this:
Lists
In this case, we define lists as places in our template where one of our placeholder texts with a content control will output a list of values. We see this in our competencies section, where we expect a bullet list of values, and we also have some contact details where we expect a phone number, email, and location.
The competencies are listed as an array (marked with []). The list is not structured, meaning each value or competence does not have a key, but only values are listed. There is no need to transform this data as a binding can output this list.
{
    "competencies": [
        "Communication",
        "Judgement/decision making",
        "Quick thinking/learning"
    ]
}
{
competencies: @.competencies
}{
"competencies": [
"Communication",
"Judgement/decision making",
"Quick thinking/learning"
]
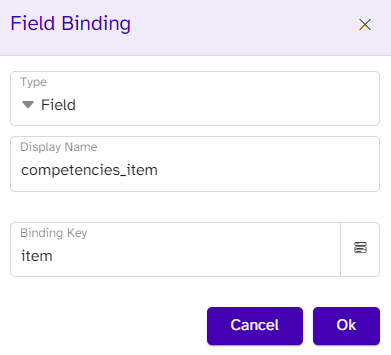
}In terms of binding in the template, we add a usual Field binding around our placeholder text. Because we bind to an array with no keys, we use the binding key named item which will refer to all the values.
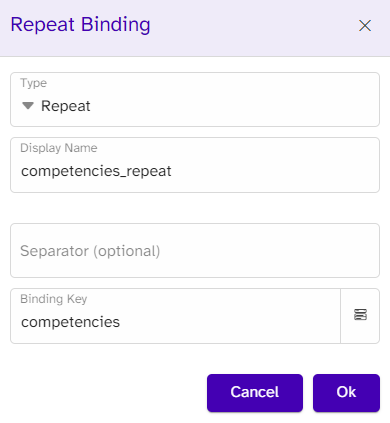
As we want the bullet and a value for each competence to be listed, we add a Repeat binding around the Field binding, which will repeat the bullet and the value until all the items from the array are listed in the template.
With the contact information, we do not have an array with all the information, but the information is listed as separate keys. It is possible to gather all the information we want in one single output. To do this, we transform the data with the join_hide function, which joins the strings of an array with a separator between each string. Opposite the join function, the join_hide will ignore elements in an array that are null or whitespace, which is useful if one of the values is not represented in the data. We collect our keys in square brackets as the function only accepts an array and use the linebreak function (`”\n”`) as the separator. Note that this approach can be less scaleable if you later make the phone number bold or add a link, as all the information is now considered one unit, whereas the separate content controls make it easier to adjust information and style.
{
    "contact": {
        "phonenumber": "+45 70 20 72 47",
        "email": "John@omnidocs.com",
        "location": "Barcelona, Spain",
        "linkedinLink": "https://www.linkedin.com/"
    }
}
{
contact: contact.join_hide(`"\n"`,[phonenumber, email, location])
}{
"contact": "+45 70 20 72 47\njane@omnidocs.com\nOdense, Denmark"
}Image and hyperlink
In this section, we will add the image and hyperlink to the template.
The images used in our CVs are in our data as URL we are able to access. DocuMotor can bind URLs; why we don’t transform this part.
{
    "image": "https://omnidocs.blob.core.windows.net..(...)
}
{
image:@.image
}{
"image": "https://omnidocs.blob.core.windows.net..(...)
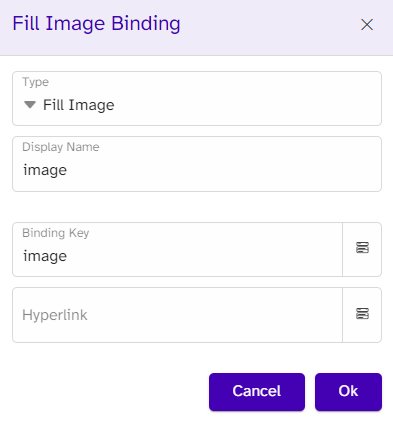
}To bind the image in the template, we will need an image placeholder. We choose the binding type FillImage as we want the image to fit the placeholder, and we bind it to the key named image.
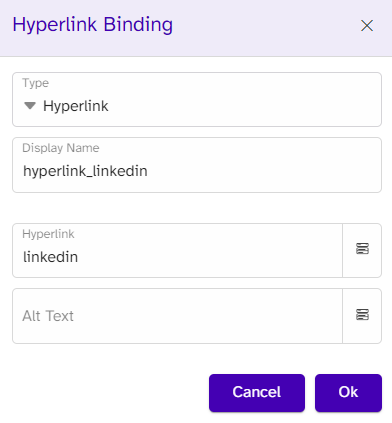
In the contact box, we have a link to the candidates’ LinkedIn page. For this type, we use the Hyperlink option and locate the URL; this will make the placeholder word clickable.
Tables
Our candidates’ educations and experiences are listed in the template as two tables, and we will use different transformations for each of them.
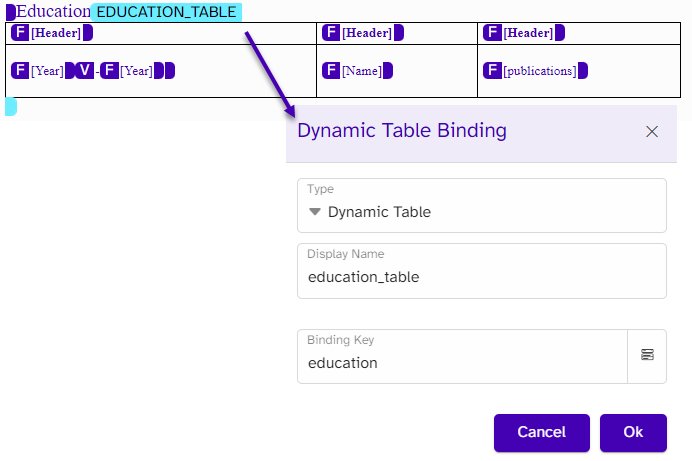
In the template with the education, we have three columns with years, the name, and relevant publications. From our template mapping, we know that the publications column is not relevant for all candidates, and therefore we want to hide this column if it’s not relevant. To address this, we need to transform our data into a Dynamic Table.
Our data is placed in an array with an object for each education.
{
    "education": [
        {
            "year_from": "20151221",
            "year_to": "20171111",
            "name": "Masters degree, Software Developement, IT University",
            "publications": "A study about Clean Code"
        },
        {
            "year_from": "20120306",
            "year_to": "20151105",
            "name": "Bachelor of Arts, Information Technology, Aalborg University"
        }
    ]
}
To make a dynamic table, we need to output a specific structure; this is elaborated on in the article here. The first step in our transformation is to make sure we check for the right amount of headers we need; we use the if function and has_value to check if the publications are in every object for each education. If the publication is not a key in an object, only two columns should be visible; if it is visible, the third column will show. In the rows part of the transformation, we give the strings ‘Years’, ‘Name’, ‘Publications’ in an array as the headers; these are not pulled from the data.
In the next rows, we map the name, the years from/to, and the publications, if any. Note that both dates are listed like this: 20161122, but we only need the year in this table. If you need to repeat the same function or other transformations multiple times or use it across different templates within a tenant, consider making a custom function. To transform the date, we create a function that (similar to the date field) formats the string into a date time, using the to_datetime function that converts text to a date time object using a format and a culture. We list the text we want to transform as the #Date, next we analyze the string or text from the data set (e.g. 20161122), and recognize the current logic where the year is listed first and next the month and day (yyyyMMdd), this is the format, and lastly, we add the English syntax as culture. We take this expression and add it into a format function as the data to format, we add the desired format (yyyy) and English culture (en-GB) to finish the function.
{
    format(to_datetime(#Date, 'yyyyMMdd', 'en-GB'), 'yyyy','en-GB')
}
With the custom function in place, we are able to call our function and the date we want it to transform, which is the year_from: #DateFormat(year_from) and year_to: #DateFormat(year_to).
The finished dynamic table transformation looks like this:
{
    //Education table
    education:@.education.
    {
        //Check if the candidate has any publications
        Headers: if(has_value(parent(@).education[*].publications),
            //If true make third column visible
            [
                {Visible: `true`},
                {Visible: `true`},
                {Visible: `true`}
            ],
            //If false hide third column
            [
                {Visible: `true`},
                {Visible: `true`}
            ]),
        Rows: [
            {
                ColumnHeaders:['Years', 'Name', 'Publications']
            },
            [*].{
                year_from: #DateFormat(year_from),
                year_to: #DateFormat(year_to), //format the dates from year-months-day to year only
                name: name,
                publications: publications
            }
        ][]
    }
}
In the template, a table is placed with a header row and a single row, which we expect to adjust to the amount of data. The content of the table is bound with standard field and visibility bindings. Unique to the dynamic table is the binding around the table, which is the type: Dynamic Table and is bound to the key of the entire table transformation: education.
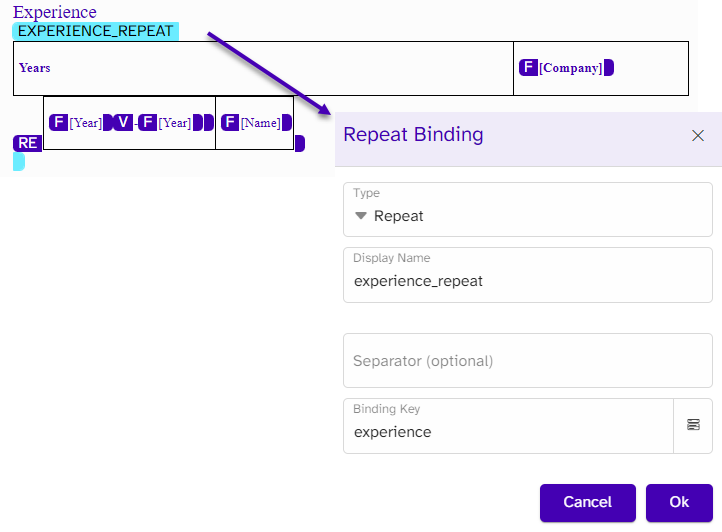
The experience table uses a different approach compared to the education table. In this one, no dynamic table is needed as the table is static in its structure of columns and layout, and only the number of rows is adjusted to the data. However, from our mapping, we know we want the table repeated per experience, but if the candidate changes title or position within a company already on the list, this information needs to be grouped under the same company and not repeated as a separate experience.
The data is structured as follows for one of the candidates:
{
    "experience": [
        {
            "year_from": "20161122",
            "year_to": "20170101",
            "name": "Software Tester",
            "company": "Omnidocs"
        },
        {
            "year_from": "20171111",
            "year_to": "20190102",
            "name": "Technical Supporter",
            "company": "Omnidocs"
        },
        {
            "year_from": "20190102",
            "year_to": "20200402",
            "name": "Manager",
            "company": "Webtown"
        },
        {
            "year_from": "20200402",
            "year_to": "",
            "name": "Technical Lead",
            "company": "DocCompany"
        }
    ]
}
In our transformation we start by sorting the data to ensure the data is in the right order. We use the sort_by function, fill in the array name (experience) as the data to sort and the year_from key to sort by. Next we use the group_adjacet function give an array of all groups, whereas each group is an array of elements in that group. We use the sort_by expression as the data to group and we give the company as the expression for comparing each element. We pull the company name from the data, and add a [0] as we only want one company name if the same name is mentioned twice. To format the relevant dates for each position, we use our #DateFormat function to make sure only the year is displayed. The transformation and output look like the following:
{
    //Experience table (sorted by year and grouped by company)
    experience: group_adjacent(sort_by(@.experience, &year_from), &company)[*].
    {
        company:[0].company,
        positions: [*].
        {
            name:name,
            year_from: #DateFormat(year_from),
            year_to: #DateFormat(year_to)
        }
    }
}
{
"experience": [
{
"company": "Omnidocs",
"positions": [
{
"name": "Software Tester",
"year_from": "2016",
"year_to": "2017"
},
{
"name": "Technical Supporter",
"year_from": "2017",
"year_to": "2019"
}
]
},
{
"company": "Webtown",
"positions": [
{
"name": "Manager",
"year_from": "2019",
"year_to": "2020"
}
]
},
{
"company": "DocCompany",
"positions": [
{
"name": "Technical Lead",
"year_from": "2020",
"year_to": ""
}
]
}
]
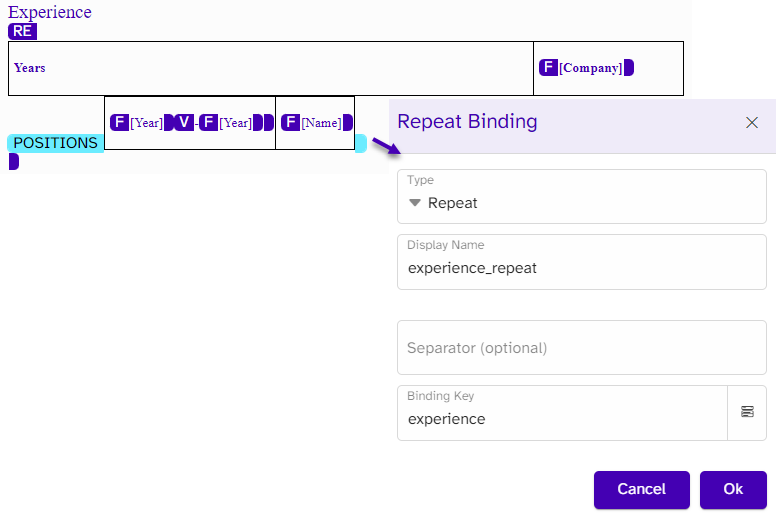
}In the template, we use a repeat around the entire table and repeat on the experience array. As a candidate can have more positions, we also repeat the row where the positions are mentioned. Other fields are mapped with the standard field bindings.
Chart
In the final section, we have a chart:
The data used to format a standard chart placed in the template is structured as objects in an array named skills.
{
    "competence": {
        "skills": [
            {
                "skill": "Web design",
                "pct": "50",
                "marketAverage": "45"
            },
            {
                "skill": "PHP",
                "pct": "15",
                "marketAverage": "30"
            },
            {
                "skill": "JavaScript",
                "pct": "60",
                "marketAverage": "40"
            },
            {
                "skill": "C#",
                "pct": "80",
                "marketAverage": "15"
            },
            {
                "skill": "C++",
                "pct": "35",
                "marketAverage": "20"
            }
        ]
    }
}
When constructing a chart in DocuMotor, a specific structure must be followed. To see the different structures for the different types of charts see this article. We start mapping the categories into an array. Series also needs to be in an array with objects, one object for each series, and two keys are added each to show two columns for each skill, one column with the candidate’s skills and one with the avenge skill level of the market.
{
    //Competence chart
    competence_chart:
    {
        categories: @.competence.skills[].skill,
        series: [
            {
                name: 'Candidate level',
                values:@.competence.skills[].pct
            },
            {
                name: 'Market average',
                values:@.competence.skills[].marketAverage
            }
        ]
    }
}
The following is the output of the transformation:
{
"competence_chart": {
"categories": [
"Web design",
"PHP",
"JavaScript",
"C#",
"C++"
],
"series": [
{
"name": "Candidate level",
"values": [
"90",
"50",
"20",
"30",
"100"
]
},
{
"name": "Market average",
"values": [
"45",
"30",
"40",
"15",
"20"
]
}
]
}
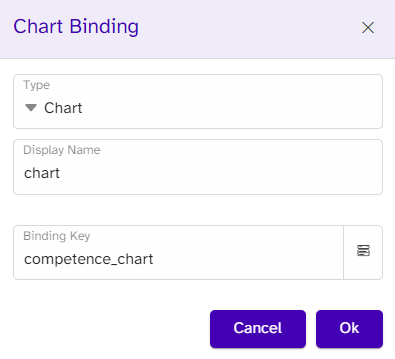
}In the template, a chart is already added, as previously mentioned, and will be transformed by the data. A chart binding is needed to create the connection between the chart and the data, meaning the binding type is Chart, and the binding key is the name of the array: competence_chart.
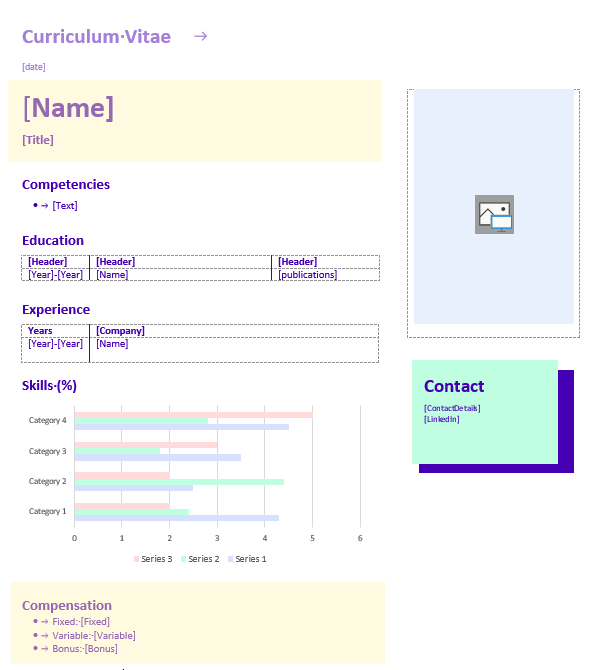
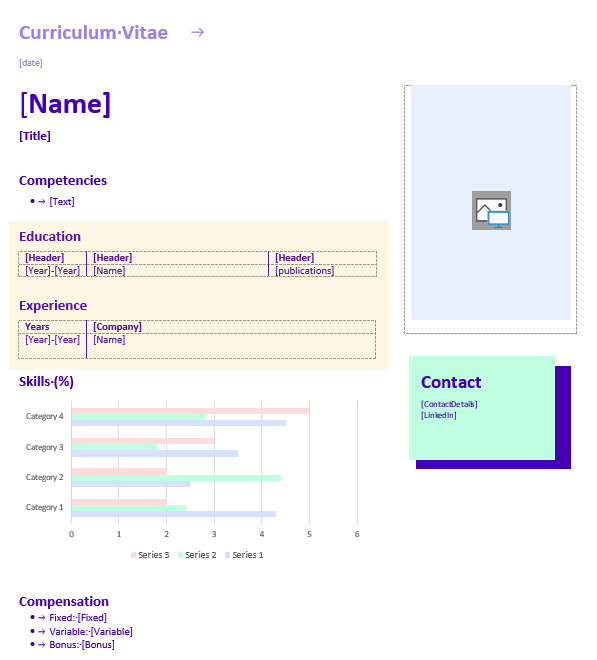
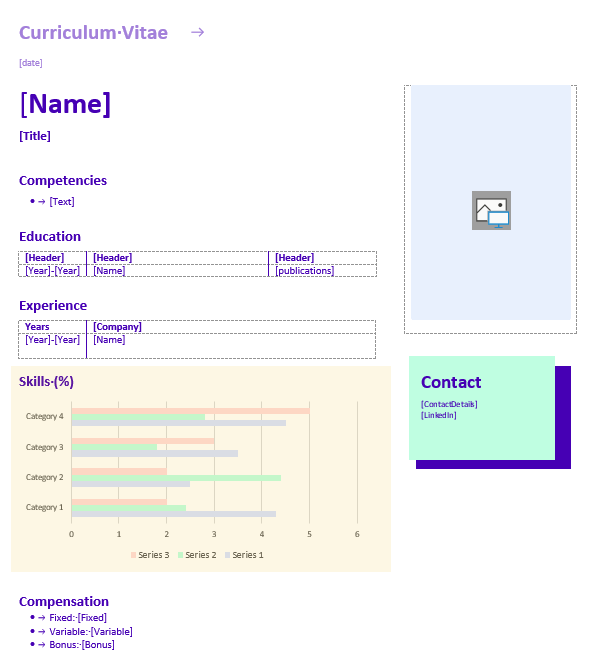
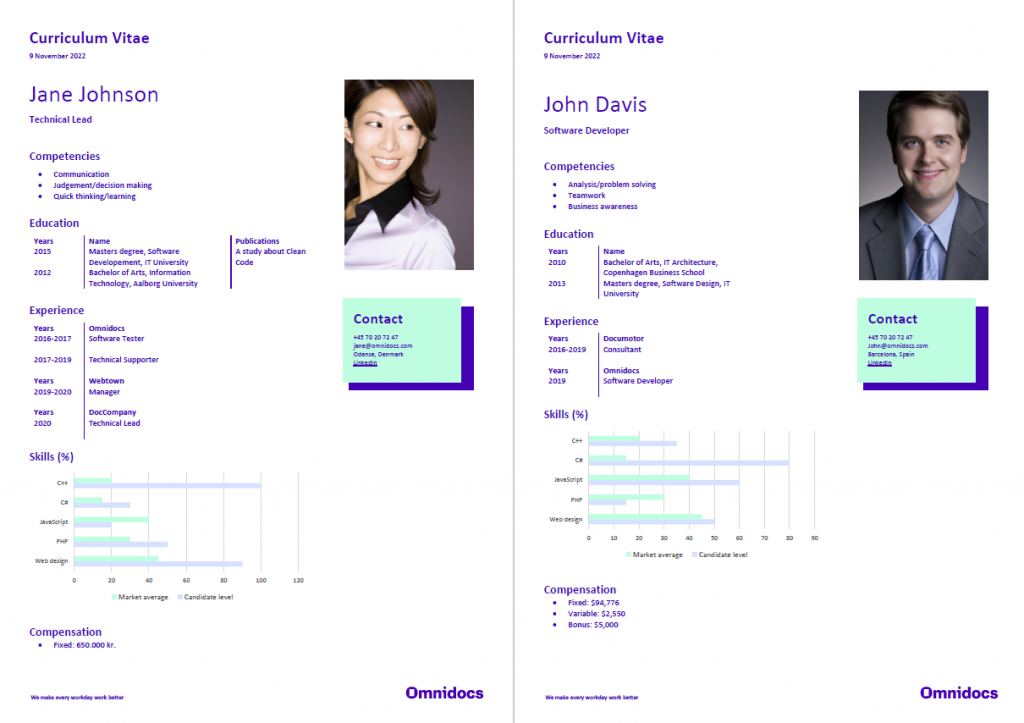
The final result
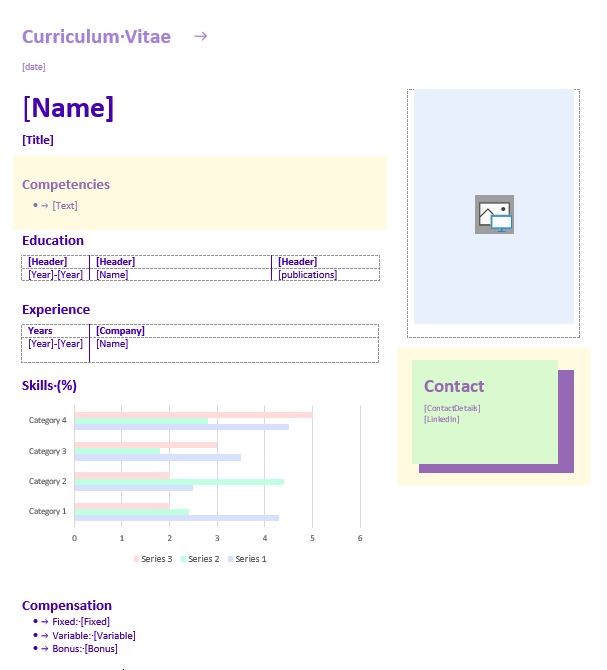
When all the data is transformed and all the bindings are in place, the following CVs are generated:
If you have any questions or need assistance with DocuMotor, don’t hesitate to reach out to us!